



The International Air Transport Association (IATA) has released the latest version of the World Air Transport Statistics (WATS) report for 2024. Compiled annually using data from more than 240 airlines, this comprehensive report offers a detailed overview of the sector in key areas such as global passenger and cargo traffic, fleet structure, airport density, operating costs, and revenues.
Record Growth in Premium Class Travel
According to 2024 data, international premium class travel (business and first class) grew by 11.8% year-on-year, surpassing economy class growth (11.5%). A total of 116.9 million passengers travelled in premium class, making up 6% of all international passengers.
The most notable premium class growth occurred in the Asia-Pacific region. The number of premium class passengers in the region rose by 22.8% to reach 21 million, while economy class travel also saw a record increase of 28.6%, hitting 500.8 million passengers.

Europe continued to be the largest premium class market with 39.3 million passengers, while the Middle East led in terms of the percentage of premium travellers within total passengers, at 14.7%. The faster growth of the premium segment compared to economy suggests that airlines’ strategies targeting high-income passengers have been successful.
Busiest Routes: Asia-Pacific at the Top
WATS 2024 data revealed that the world’s busiest airport pairs are largely located in the Asia-Pacific region. With 13.2 million passengers, the Jeju–Seoul (CJU–GMP) route was the busiest air route of the year. Except for Jeddah–Riyadh (JED–RUH), all routes in the top 10 were in the Asia-Pacific region.
The busiest routes by region were as follows:
-
Latin America: Bogotá–Medellín (3.8 million passengers)
-
Africa: Cape Town–Johannesburg (3.3 million passengers)
-
North America: New York JFK – Los Angeles LAX (2.2 million passengers)
-
Europe: Barcelona – Palma de Mallorca (2 million passengers)

Most Preferred Aircraft Models
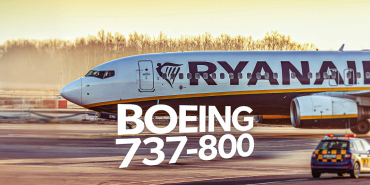
In 2024, the most used aircraft type globally was the Boeing 737 (all variants included). These aircraft completed 10 million flights and recorded 2.4 trillion available seat kilometres (ASK), placing them first. The Airbus A320 followed with 7.9 million flights and 1.7 trillion ASK, while the Airbus A321 ranked third with 3.4 million flights and 1.1 trillion ASK.
Performance data of the most widely used narrow-body aircraft:
| Aircraft Model | Number of Flights | Annual Change | ASK (Billion) | ASK Annual Change |
|---|---|---|---|---|
| Boeing 737 | 10 million | 6% | 2,442 | 9.5% |
| Airbus A320 | 7.9 million | 4.8% | 1,705.7 | 6% |
| Airbus A321 | 3.4 million | 10.1% | 1,124.1 | 12.5% |
| Airbus A319 | 1.4 million | -6% | 204.2 | -4.9% |
| Airbus A220 | 411,543 | 21.7% | 66.6 | 20.4% |
Largest Passenger Markets: The U.S. Maintains the Lead
In 2024, the United States remained the world’s largest aviation market with 876 million passengers. This growth was driven in part by a 5.2% annual increase in domestic traffic.
China ranked second with 741 million passengers, showing an impressive 18.7% year-on-year growth. It was followed by the United Kingdom, Spain, India, and Japan.
| Country | Number of Passengers | Annual Change |
|---|---|---|
| USA | 876 million | 5.2% |
| China | 741 million | 18.7% |
| United Kingdom | 261 million | 7.3% |
| Spain | 241 million | 10.7% |
| India | 211 million | 11.1% |
| Japan | 205 million | 18.6% |